 David Torres
Most people assume solar panels basically shut down on cloudy days. That assumption is wrong, and it’s been costing homeowners real money in the form of undersized systems and misplaced skepticism about solar viability in places like Seattle, Portland, or pretty much anywhere north of the Mason-Dixon line.
Here’s what actually happens: solar panels generate electricity from diffuse light, not direct sunlight. Clouds scatter and filter photons, sure, but they don’t block all of them. On a typical overcast day, a well-installed residential system might produce somewhere between 10% and 25% of its rated output. On a lightly overcast day, closer to 50%. Those aren’t my numbers, by the way. The National Renewable Energy Laboratory (NREL) has published detailed irradiance data going back decades, and the relationship between cloud cover and panel output is well-documented and, honestly, more forgiving than the solar skeptics will admit.
What surprised me, though, was something I stumbled onto while sizing a system for a client in Vermont a few years back: sometimes panels actually produce more power during partial cloud cover than on a clear day. It’s called the “edge of cloud” effect. When the sun is partially obscured and the edge of a cloud acts like a lens, concentrating and redirecting diffuse light, you can get a brief spike in irradiance beyond the standard 1000 W/m² used in panel ratings. I’d heard about this theoretically, but seeing it on a live monitoring dashboard for the first time genuinely caught me off guard.
Solar production varies significantly depending on cloud density, here's what to realistically expect from a typical residential system under different sky conditions.
| Sky Condition | Typical Output (% of Rated Capacity) | Approximate Irradiance (W/m²) | What You'll Notice |
|---|---|---|---|
| Clear sky, full sun | 90-100% | 900-1000+ | Peak production; inverter near max output |
| Light haze or thin cirrus | 70-85% | 700-850 | Slight dip; often unnoticed without monitoring |
| Partly cloudy (broken cumulus) | 50-75%* | 500-800* | Fluctuating output; possible brief spikes from edge-of-cloud effect |
| Overcast (uniform stratus) | 25-40% | 250-400 | Steady but reduced; still useful production |
| Heavy overcast or rain | 10-25% | 100-250 | Minimal but non-zero; covers standby loads |
| Dense storm clouds | 5-15% | 50-150 | Near-baseline; [inverter may cycle off briefly](/solar-inverter-troubleshooting-guide/) |
| *Partly cloudy conditions can briefly exceed 100% output during edge-of-cloud events, sometimes hitting 1,200+ W/m² for seconds to minutes. | |||
General information for comparison, confirm specifics for your situation.
Why Germany Proves the Point
Germany is the example I use every time someone tells me solar doesn’t work in cloudy climates. For years, Germany was one of the top solar markets in the world, punching well above its weight in installed capacity relative to its latitude and cloud cover. They’re roughly on par with Canada weather-wise. Not exactly the Sahara.
The reason that worked isn’t magic. Good system design, strong net metering policy, and the reality that annual solar resource (not daily production) determines whether a system actually pays off financially. A system producing 80% of what a Phoenix system produces, but costing the same to install, might still work financially if your electricity rates are high enough. Germany had high rates. Vermont, Massachusetts, and New York do too, which explains why residential solar adoption there has kept growing despite the lack of California-style sunshine.
I’ll be honest: the economics get messier in genuinely low-sunshine areas when you’re calculating simple payback. But “it doesn’t work” and “it produces less than in a sunnier place” are completely different claims. One is false. The other is just math.
What’s Actually Happening Inside the Panel
The physics here is worth understanding if you want to have an informed conversation with an installer rather than just nodding along.
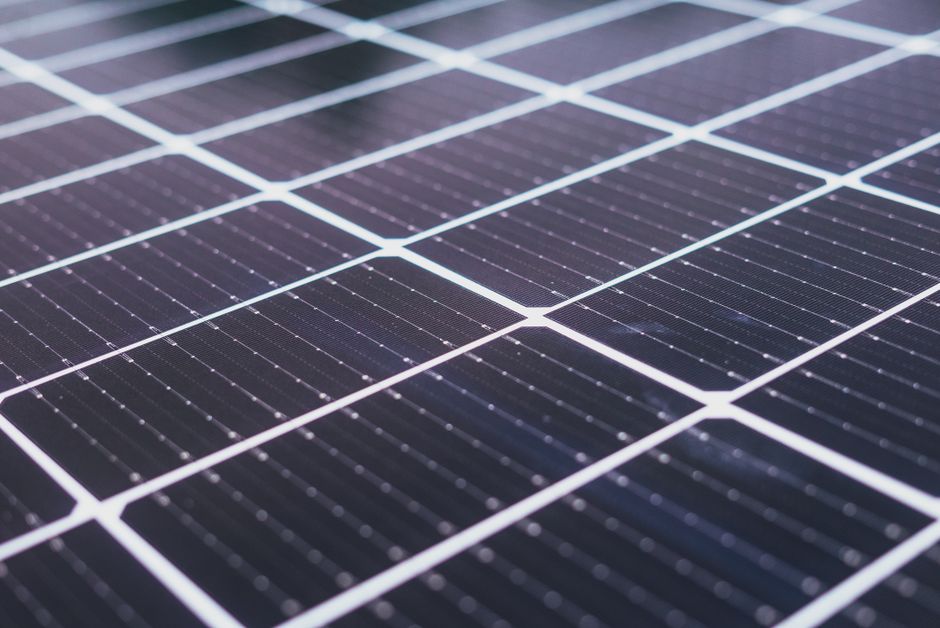
Solar panels are made of photovoltaic cells, most commonly silicon. When photons hit silicon, they knock electrons loose and generate a current. What matters is the energy in those photons, specifically whether they’re in the right part of the spectrum to interact with silicon. Clouds don’t eliminate the photon flux. They scatter it. Diffuse radiation, which is the term for light that’s been scattered by the atmosphere or clouds, still contains photons in the wavelengths silicon responds to.
Different panel technologies respond to diffuse light differently. This actually matters at a practical level. Monocrystalline silicon panels, which dominate 2024 residential installs, perform reasonably well in diffuse light. Thin-film panels, particularly cadmium telluride (CdTe) products like those made by First Solar, have a slightly different spectral response that makes them comparatively better under diffuse and low-light conditions. That’s one reason you’ll see thin-film used more often in utility-scale projects in cloudier northern regions.
If you’re in a consistently overcast climate and choosing between two panels with similar pricing, this is actually worth asking your installer about rather than defaulting to whatever they have in the warehouse.
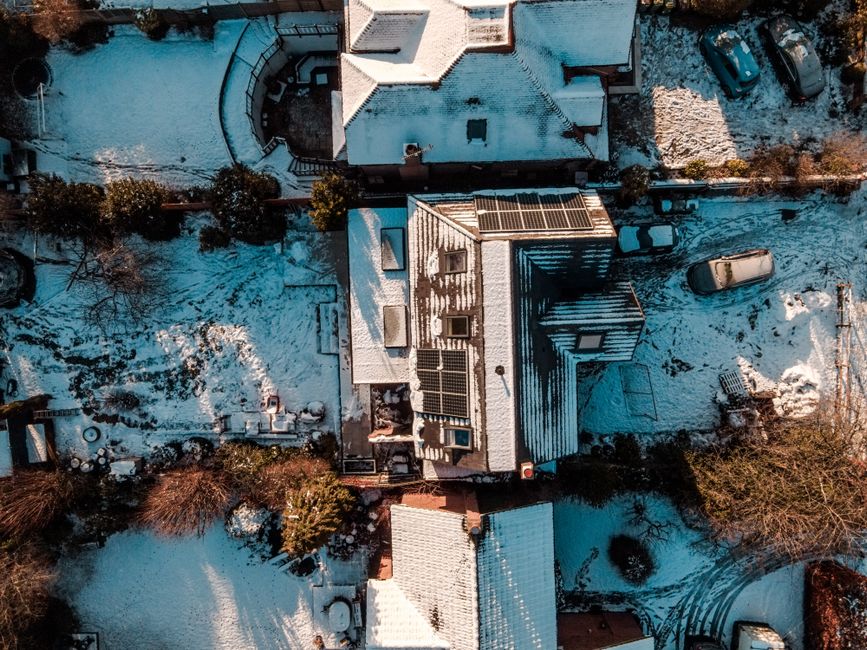
Bifacial panels are another consideration. They capture reflected light from below as well as direct light from above. In snowy climates specifically, the albedo from snow on the ground can meaningfully improve winter production from bifacial panels. I’ve seen quoted estimates of 10-20% additional yield in the right conditions. The research is mixed depending on mounting height and ground surface, but it’s real.
The Monitoring Data Doesn’t Lie
Basic Solar Components & How They Work - Solar Panels, Inverter, Batteries, & More Explained (Ep. 2) · The Solar Lab on YouTube
If you already have solar, pull up your monitoring app right now. I use the Enphase Enlighten app for most of my clients’ systems; SolarEdge has their own monitoring platform too. On your next cloudy day, watch what happens. You won’t see zero. You’ll see reduced output, probably a flattened bell curve instead of the sharp peak you get on a clear day, but the system is working.
One thing I tell everyone: get a home energy monitor if you don’t have panel-level monitoring already. Something like the Emporia Vue (around $80-100) gives you real-time whole-home data and lets you correlate your solar production against weather events. (Note: this site may earn a commission on qualifying Amazon purchases.) Watching that data through the seasons teaches you more about your system than any installer conversation will.
What I found with my own system over the first full year of monitoring: my December production in the mid-Atlantic region was about 35% of my July production. December here means short days, low sun angle, and frequent cloud cover. But 35% of peak summer is still electricity. That’s still grid power I’m not buying.
How to Think About System Sizing in Cloudy Climates
This is where things get real, and where a lot of installers do mediocre work.
Good system sizing accounts for your specific location’s annual peak sun hours, not some idealized national average. Peak sun hours measures the equivalent number of hours per day when solar irradiance averages 1000 W/m². Portland, Oregon gets roughly 3.9-4.2 peak sun hours per day annually. Miami gets around 5.5-5.7. The difference is real, but Portland isn’t a solar wasteland.
A competent installer pulls location-specific data from PVWatts, which is NREL’s free online tool, and shows you projected monthly production numbers based on your roof’s orientation, tilt, and local weather patterns. If an installer is just handing you a one-page proposal with annual production estimates and no monthly breakdown, push back. Ask to see the PVWatts report. It’s public, it’s free, and it should be the foundation of any serious proposal.
The other lever is battery storage. If you’re in a cloudy climate and you want energy independence, a battery like the Tesla Powerwall 3 (currently around $11,500 installed, though pricing varies by region and installer) or the Enphase IQ Battery 5P lets you bank excess production from sunny days against cloudy stretches. The Solar Energy Industries Association (SEIA) has reported that paired solar-plus-storage installations are growing sharply, and honestly, in a high-cloud-cover region, that pairing makes more sense than it does in Arizona where you’re likely to have production when you need it.
I’ll admit that battery storage math in cloudy climates gets complicated fast. If your system is producing 25% of rated output for five consecutive days, a single Powerwall might not cover your overnight needs every day. This isn’t a reason to avoid solar; it is a reason to size your storage honestly and not let an installer oversell you on a battery system that can’t actually do what you’re hoping.
Seasonal Expectations vs. Seasonal Reality
Winter disappoints people who weren’t given realistic expectations. I’ve gotten emails from homeowners genuinely convinced their system was broken because January production was so much lower than August. It wasn’t broken. It was November in Ohio.
The mental shift you need: stop thinking about daily production and start thinking about annual production. Your utility bill is annual. Your loan payment is annual. The question isn’t “did I produce enough today” but “am I on track for the year.” Most monitoring platforms show you a running annual total versus your projected annual total. That’s the number that matters.
There’s also a real but underappreciated advantage to cold temperatures in cloudy climates: panels are more efficient when they’re cool. Silicon-based solar panels lose roughly 0.3-0.5% efficiency for every degree Celsius above 25°C. A 250-watt panel running at 70°C in August heat is performing meaningfully worse than its nameplate rating suggests. That same panel on a cold November day at 10°C is running above its rated efficiency. So the cloud cover hurts you in winter, but the temperature helps. These effects partially offset each other, and in very hot climates the heat penalty in summer is more significant than most installers mention.
Don’t let a string of gray days convince you your system isn’t doing its job. Watch the annual totals. Understand your local peak sun hours before you size anything. And if an installer can’t show you a monthly PVWatts breakdown for your specific roof, find one who can.
Sources
- National Renewable Energy Laboratory (NREL)
- Emporia Vue
- Solar Energy Industries Association (SEIA)
- Lutron Caséta Wireless Smart Dimmer Kit
- Emporia Vue 2 Home Energy Monitor
Disclosure: As an Amazon Associate, we earn a small commission from qualifying purchases at no extra cost to you. We only recommend products that genuinely support the topics covered in this article.
- Renogy 200W Solar Starter Kit + 30A Charge Controller (~$169), Complete beginner solar kit, 200W monocrystalline panel, charge controller, and mounting hardware included.
- Renogy 2×100W Monocrystalline Solar Panels (~$99), Expandable 200W panel set from the most trusted DIY solar brand, used widely in off-grid and home backup systems.
Recommended Resources
Disclosure: As an Amazon Associate, we earn a small commission from qualifying purchases at no extra cost to you. We only recommend products that genuinely support the topics covered in this article.
- Renogy 200W Solar Starter Kit + 30A Charge Controller (~$169), Complete beginner solar kit, 200W monocrystalline panel, charge controller, and mounting hardware included.
- Renogy 2×100W Monocrystalline Solar Panels (~$99), Expandable 200W panel set from the most trusted DIY solar brand, used widely in off-grid and home backup systems.