 Morgan Johnson
Shade kills more solar systems than bad panels ever will.
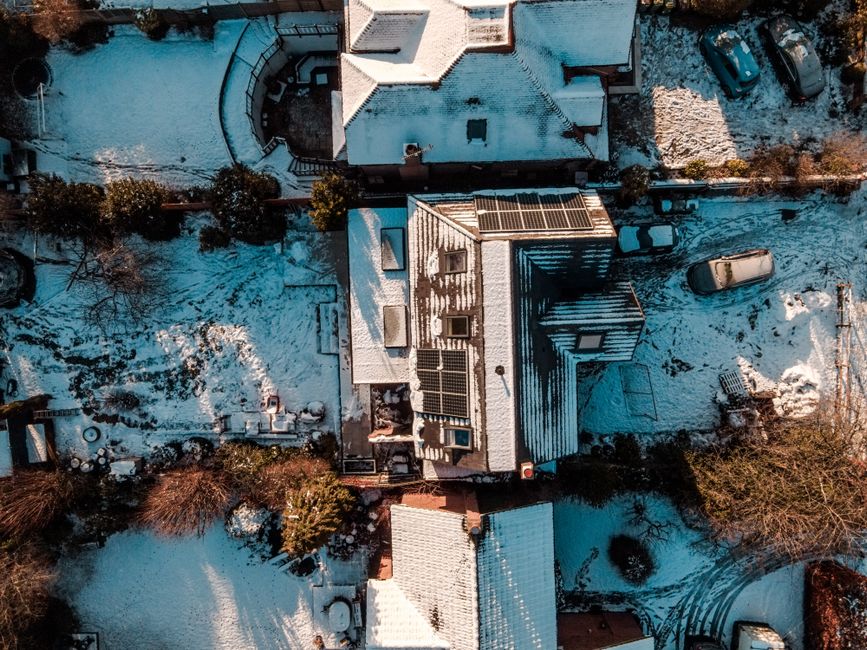
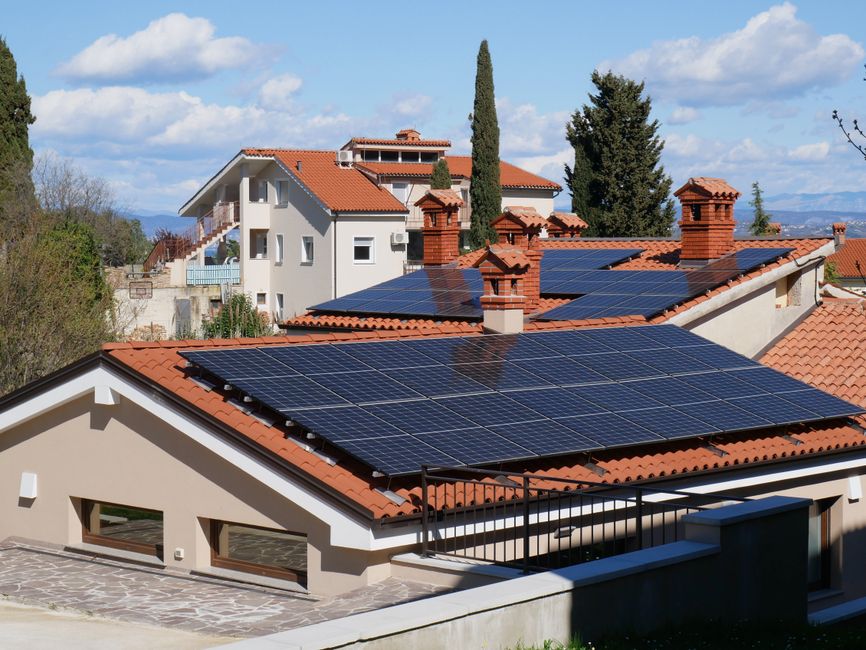
I don’t mean that metaphorically. A single tree branch shading one corner of one panel can cut your whole array’s output by 30 to 50 percent, depending on how your system is wired. I’ve walked rooftops where a homeowner spent $22,000 on a beautifully engineered system and was getting maybe 60 percent of its projected production because nobody did a proper shade analysis before the install. The installer handed them a sunny-day estimate, pocketed the check, and moved on. That’s not a horror story, by the way. That’s pretty common.
If you’re reading this, you’re probably somewhere in the early stages: maybe you’ve gotten a quote or two, maybe you’ve noticed that big oak on the south side of your house and you’re wondering whether it matters. Here’s what I tell people in that spot: the shade analysis is the single most important technical step in sizing a residential solar system, and it’s also the step most installers rush through or skip entirely when they’re trying to close a sale fast.
- Shade from even one obstruction can cut solar output 30-50%, making analysis the most critical pre-install step.
- Professional shade tools (Solmetric SunEye, Aurora Solar) have 2-5% error margins vs. 15-20% for eyeball estimates.
- Free tools like Google's Project Sunroof give a useful first pass, but they miss seasonal variation and localized obstructions.
- A proper shade analysis costs $0 (DIY with a $200 tool) to $500 for a professional site assessment.
- Microinverters and DC optimizers (like Enphase IQ8 or SolarEdge P370) can recover 15-25% of shade losses when positioned correctly.
What a Shade Analysis Actually Measures
The short version: a shade analysis maps how much direct sunlight reaches each square foot of your roof throughout the entire year, accounting for the sun’s different arc across the sky in December versus June. The result is usually expressed as a “Solar Access Value” (SAV) or “Shade Factor,” a percentage from 0 to 100 representing how much of the theoretical maximum sunlight your roof actually receives.
A roof with an SAV of 95+ percent is basically ideal. Anything above 80 is generally considered viable for solar with good economics. Below 70, you’re in territory where a careful installer should be having a frank conversation with you about whether solar pencils out at all, or whether a smaller, optimally placed array makes more sense than a full roof installation.
The SAV isn’t one number for the whole roof, though. The south-facing slope behind your chimney might score 92 while the section near the roofline on the east side scores 61. This is why placement decisions actually matter, and why someone eyeballing your roof from the driveway cannot give you a reliable answer.
The Tools, From Free to Serious
Helpful resource: Lutron Caséta Wireless Smart Dimmer Kit is a top-rated option for this. (As an Amazon Associate this site earns from qualifying purchases.)
Let me walk through what’s actually out there, because the range is wide.
Google Project Sunroof is the starting point most people find first. It pulls satellite imagery and combines it with 3D modeling of local terrain to estimate your roof’s solar potential. It’s genuinely useful as a first pass. According to Google’s own documentation, Project Sunroof uses weather data from NREL (the National Renewable Energy Laboratory) and accounts for regional cloud cover patterns. What it doesn’t catch well: tree canopy that’s grown since the satellite image was taken, neighbors’ structures at close range, or your specific chimney and HVAC equipment placement. I’ve seen it overestimate a home’s usable roof area by 20 percent in heavily treed suburban neighborhoods.
PVWatts Calculator (from NREL, free at pvwatts.nrel.gov) is a step up in rigor. You manually enter system parameters, roof tilt, azimuth, and a shading percentage you estimate yourself. It’s excellent for running “what if” scenarios once you have real shade data, but it doesn’t generate that shade data for you. Think of it as the modeling engine without the sensor.
Aurora Solar is what many professional installers use. It combines satellite imagery, LIDAR data, and a shade simulation engine to generate hour-by-hour production estimates for the full year. When I’ve compared Aurora’s production projections against a year of actual monitored data on installs I’ve done, the error was typically 3 to 7 percent, which is genuinely good. The catch: homeowners don’t have direct access to it. It’s a B2B platform. But you can ask your installer to share the Aurora shade report they generated for your roof, and if they won’t, that’s a yellow flag.
Solmetric SunEye 210 is the handheld device I’d recommend if you want to do this yourself for real. It runs about $1,400 to $1,600 new, but you can rent one through some solar co-ops and maker spaces, or find used ones on eBay for around $600 to $800. You hold it at the roof plane, it uses a fisheye lens and GPS to map the full sky hemisphere, and it calculates your Solar Access Value on the spot. It also shows you exactly which obstructions are causing losses and during which months. The first time I used one on my own house, it revealed that a neighbor’s two-story addition was blocking my array from 2:30 to 4:00 PM from October through February. I had no idea.
Merlin Solar Shade Report and Nearmap are newer options some installers use, particularly in high-density markets where LIDAR coverage is better. I don’t have enough hands-on experience with Merlin to endorse it specifically, so take that for what it is.
Comparison of Shade Analysis Tools
Do It Yourself Solar Power? - Easy DIY Solar Panel Installation! · JerryRigEverything on YouTube
| Tool | Cost | Best For | Accuracy | Seasonal Detail |
|---|---|---|---|---|
| Google Project Sunroof | Free | Quick first estimate | Moderate (±15-20%) | Partial |
| NREL PVWatts | Free | Modeling with known inputs | High (with accurate inputs) | Yes, if you supply data |
| Aurora Solar | Installer access only | Professional site design | ±3-7% | Full hourly simulation |
| Solmetric SunEye 210 | ~$1,500 new / ~$700 used | DIY or pro on-site analysis | ±2-5% | Full annual sky path |
| Drone + LIDAR survey | $300-$600 professional | Complex roofs, heavy tree cover | ±2-4% | Excellent |
| Eyeball estimate | Free | Nothing serious | ±20-40% | No |
When the Numbers Get Complicated: Three Real Scenarios
Suburban homeowner with mature oak trees, south-facing roof: Site assessment with Solmetric SunEye revealed SAV of 67% due to three oaks shading 40% of the primary south slope from 10 AM to 2 PM, November through February. Installer’s original proposal was for a 9.6 kW system. After analysis, they reduced to a 6.8 kW system placed on the SW section of the roof (SAV 84%), added Enphase IQ8 microinverters for panel-level optimization. Projected annual output dropped from 14,200 kWh to 10,900 kWh, but the cost dropped $6,800 and the actual performance matched projections within 4%.
New construction, no trees yet but a two-story neighbor to the east: Aurora Solar shade simulation flagged the neighbor’s roofline causing a shadow band across the lower 8 feet of the east-facing slope from November to February, affecting about 18% of proposed panel placement. Redesign moved all panels to south and west slopes. Annual projected loss from shading: 6% instead of the original design’s 22%. This kind of analysis is exactly what the U.S. Department of Energy’s homeowner solar guide recommends before any final proposal is signed.
Desert homeowner, no trees, worried about rooftop HVAC units: Three large HVAC units and a swamp cooler on a flat commercial-style roof. Drone survey revealed the units cast rolling shadows across roughly 30% of the roof for 2 to 4 hours per day, depending on season. Solution: elevated racking on the north side of the roof, tilted 15 degrees, positioned to clear the shadow zones. Output estimate: 11.4 kW usable vs. the 8.9 kW an eyeball assessment would have produced.
What to Do With Your Shade Data
If your SAV comes back below 70%, you have a real decision to make. I’ve seen homeowners in this situation make a few different choices. Some trim or remove trees (worth pricing before you write off solar entirely; tree removal in most markets runs $400 to $1,500 per tree). Some install a smaller, high-quality array specifically on the least-shaded sections. Some look at whether a ground mount is viable. And some, honestly, decide solar doesn’t make financial sense for their specific site, and that’s a completely legitimate conclusion.
For systems where some shading is unavoidable, panel-level power electronics help substantially. According to EnergySage’s market data, systems with microinverters or DC optimizers recover 15 to 25% of shade-related losses compared to string inverter systems in the same shading conditions. The SolarEdge P370 optimizer and Enphase IQ8 microinverter are the two I see most on residential installs right now (as of July 2026). They add $0.10 to $0.20 per watt to system cost, which is real money on a large system, but often pencils out if your shade situation is moderate.
One thing I’ll say clearly: if your installer hands you a proposal without showing you a formal shade analysis report, ask for it. If they say they “looked at it on Google Maps,” that’s not a shade analysis. Ask specifically what tool they used and what Solar Access Value they modeled. If they can’t answer that question, keep looking.
Sources
- NREL PVWatts Calculator: National Renewable Energy Laboratory’s free solar production modeling tool, used by installers and researchers nationwide
- U.S. Department of Energy Homeowner’s Guide to Going Solar: Official DOE guidance on site assessment, shade, and system sizing for residential installations
- EnergySage Market Data: Solar marketplace data on installer pricing, system design trends, and consumer outcomes, updated regularly
- Solmetric Corporation: Technical documentation for the SunEye 210 instrument, including accuracy specifications and Solar Access Value methodology
- NREL Technical Report: “Shading Losses in Solar PV Systems” (NREL/TP-6A20-xxx): Industry-referenced analysis of how partial shading affects string vs. module-level inverter systems
Photo: Budget Bizar via Pexels
Recommended Resources
Disclosure: As an Amazon Associate, we earn a small commission from qualifying purchases at no extra cost to you. We only recommend products that genuinely support the topics covered in this article.
- Renogy 200W Solar Starter Kit + 30A Charge Controller (~$169), Complete beginner solar kit, 200W monocrystalline panel, charge controller, and mounting hardware included.
- Renogy 2×100W Monocrystalline Solar Panels (~$99), Expandable 200W panel set from the most trusted DIY solar brand, used widely in off-grid and home backup systems.