 David Torres
Sixty percent of the homeowners I talk to have the same misconception locked in their heads: higher efficiency equals better panels. Full stop. And I get it, that’s how most appliances work. A more efficient refrigerator uses less electricity. A more efficient furnace wastes less gas. So it feels logical that a 22% efficient solar panel is just… better than a 19% one. But that framing causes real problems when you’re spending $15,000 to $30,000 on a system, and I’ve watched people pay thousands extra for efficiency they didn’t actually need.
Let me back up and explain what the number actually means, because the solar industry does a terrible job of this.
What the Efficiency Rating Is Actually Measuring
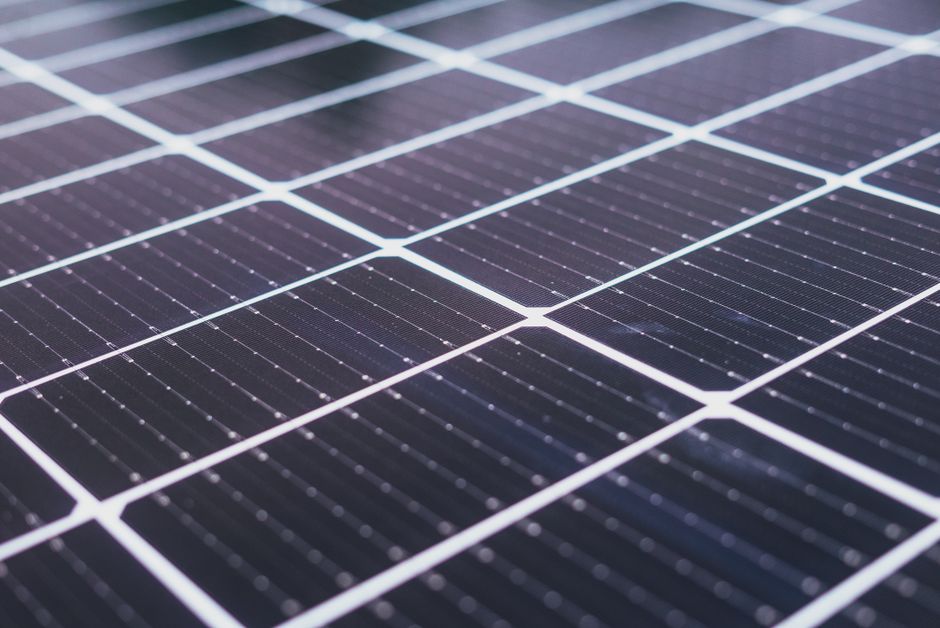
A solar panel’s efficiency rating tells you how much of the sunlight hitting the panel’s surface gets converted into usable electricity. A panel rated at 20% efficiency converts 20% of the solar energy striking it into electrical power. The other 80% becomes heat, or reflects off the surface, or gets lost in the silicon itself.
That sounds straightforward. Here’s what the number doesn’t tell you: it’s measured under something called Standard Test Conditions, or STC. That means 77°F (25°C), 1000 watts of solar irradiance per square meter, and essentially no wind. Your actual roof in Phoenix in July hits nothing close to those conditions. Neither does a rooftop in Portland in November.
The National Renewable Energy Laboratory (NREL) has done extensive work on the gap between STC ratings and real-world production, and it’s not small. Depending on your climate, a panel might produce anywhere from 10% to 25% less energy than its rated specs suggest. Which means two panels with different efficiency ratings but similar temperature coefficients and real-world derating factors can end up producing nearly identical amounts of electricity on your actual roof.
Efficiency is a useful shorthand, not a verdict.
What Actually Drives the Efficiency Number
| Cell Technology | Typical Efficiency Range | Market Position | Notes |
|---|---|---|---|
| Monocrystalline | 19-23% | Premium residential | Single crystal, fewer impurities, examples: SunPower Maxeon ~22.8%, Panasonic EverVolt ~22.2%, REC Alpha Pure-R ~22.3% |
| Polycrystalline | 15-17% | Declining/budget installs | Multiple crystals fused together, price gap to mono has narrowed |
| TOPCon | 22%+ | Emerging residential standard | Improved temperature performance, examples: LONGi Hi-MO 6, Jinko Tiger Neo |
| HJT (Heterojunction) | 22%+ | Emerging residential standard | Newer manufacturing approach, better temperature coefficient |
Three main cell technologies dominate the residential market right now, and understanding them explains most of what you’ll see on spec sheets.
Monocrystalline panels are made from a single silicon crystal. The manufacturing process is more controlled, which means fewer impurities and more paths for electrons to move freely. Most monocrystalline panels on the market today run between 19% and 23% efficiency. SunPower’s Maxeon line sits at the top around 22.8%. Panasonic’s EverVolt HK series hits around 22.2%. REC’s Alpha Pure-R panels come in around 22.3%. These are genuinely premium products.
Polycrystalline panels, made from multiple silicon crystals fused together, used to be the workhorse of the residential market. Efficiencies typically ranged from 15% to 17%. They’ve fallen out of favor mostly because the price gap between poly and mono has narrowed enough that the extra efficiency of mono makes sense for most installs. You’ll still see poly on low-budget installs or rural agricultural applications.
Then there’s TOPCon and HJT (Heterojunction Technology), which are newer manufacturing approaches that push efficiency higher while also improving temperature performance. LONGi’s Hi-MO 6 and Jinko’s Tiger Neo line are examples on the TOPCon side. These are increasingly common in residential installs and represent where the industry’s headed.
The cell architecture matters as much as the headline efficiency number.
Why Efficiency Matters Less on Big Roofs (And More on Small Ones)
Here’s the practical part most guides skip.
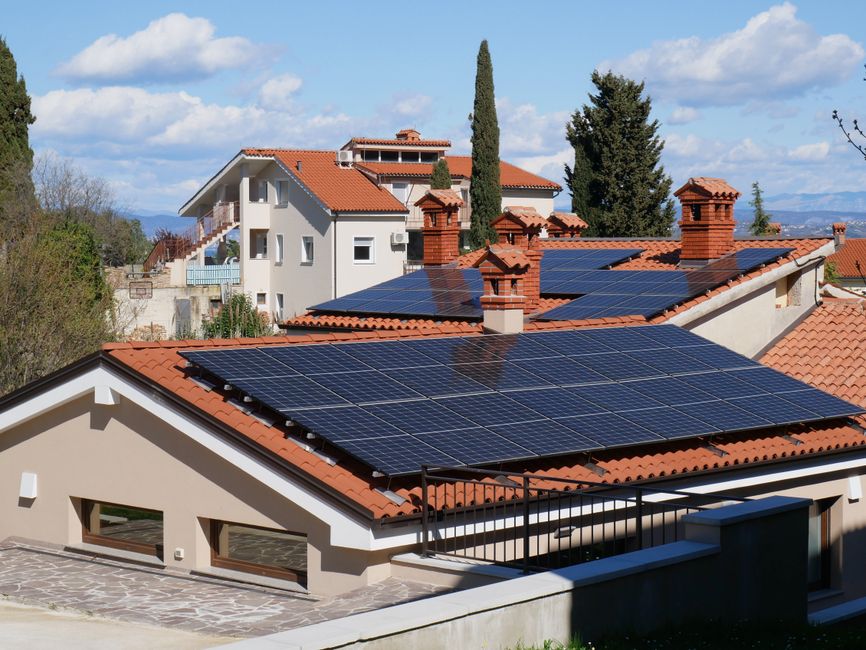
If you have a large, unshaded south-facing roof, you don’t need the most efficient panels on the market. You have space. A 400W panel rated at 20% efficiency and a 420W panel rated at 22% efficiency will give you roughly the same system output if you just add one more of the less efficient panels. The cost difference can be $1,500 to $3,000 on a typical 8-10 kW system, and you often don’t get that back in additional production within any reasonable payback window.
I made this exact case to a homeowner in Sacramento last spring. She’d been quoted a system using Maxeon 7s, which are genuinely excellent panels, but her south-facing roof had plenty of room and zero shading issues. We ran the numbers together. Swapping to a comparable Qcells Q.PEAK DUO BLK ML-G10+ system at 20.6% efficiency, and adding two panels to match the system output, saved her about $2,800 on a $22,000 quote. Same production target. Longer payback on a premium she didn’t need.
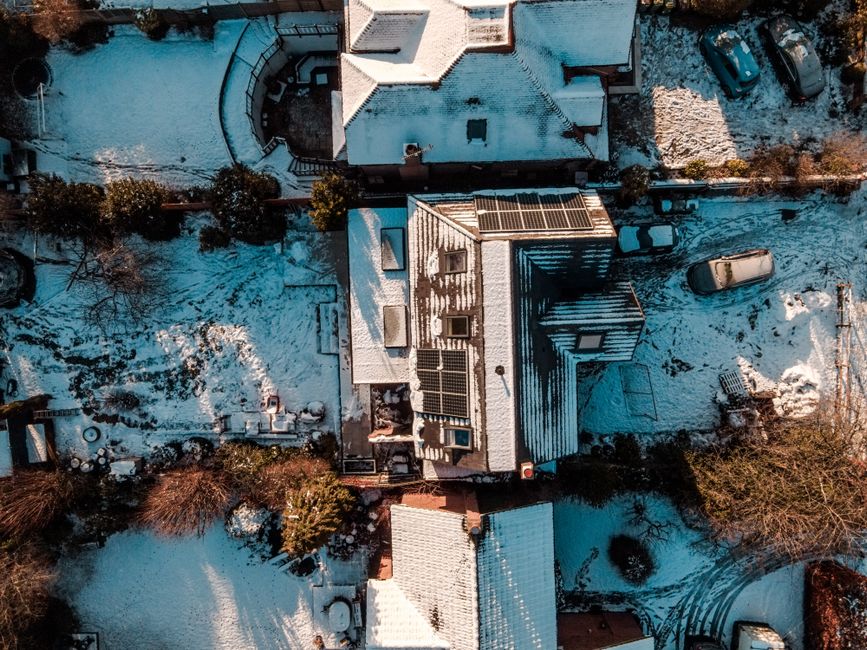
Now flip that. You’ve got a small roof, a portion of it shaded by a chimney or a neighbor’s tree, and you need to hit a 9 kW system size to offset your bills. Efficiency matters a lot. Every square foot is working harder. Going from 19% to 22% efficiency might mean the difference between hitting your production target and falling short, or between fitting the system on your main roof versus adding a ground mount you didn’t want.
The U.S. Department of Energy’s homeowner solar guide puts it plainly: total system output matters more than any single component spec. That framing isn’t just for beginners. It’s the right mental model period.
Temperature Coefficient: The Spec Nobody Reads
This one genuinely frustrates me because it matters so much and almost nobody talks about it.
Every solar panel has a temperature coefficient rating, listed as a negative percentage per degree Celsius. A typical rating might look like -0.30%/°C or -0.45%/°C. What that means: for every degree Celsius above 25°C (the STC baseline), the panel’s output drops by that percentage.
A panel with a -0.45%/°C coefficient sitting on a hot roof in August at 65°C is losing about 18% of its rated output just from heat. A panel with a -0.30%/°C coefficient loses about 12%. Over the lifetime of a system in a hot climate, that difference adds up to thousands of kilowatt-hours.
SunPower Maxeon panels have a coefficient of around -0.27%/°C. That’s genuinely impressive and part of what justifies their price in hot climates. The REC Alpha series comes in around -0.26%/°C. Cheaper commodity panels often run -0.40% or worse.
If you’re in Phoenix, Austin, Miami, or anywhere temperatures regularly push into triple digits, check this number before anything else. A panel with a modest efficiency rating but a better temperature coefficient can outperform a higher-rated panel all summer long.
Reading a Spec Sheet Without Going Cross-Eyed
Spec sheets have a reputation for being dense, and they earn it. But you really only need to focus on about five numbers.
Pmax (Maximum Power): The wattage under STC. A 415W panel produces 415 watts at peak conditions. This is the headline number you’ll see in product names.
Module Efficiency (%): That conversion percentage we’ve been discussing. Found on every spec sheet.
Temperature Coefficient of Pmax: Listed as %/°C. Lower absolute value is better, especially in warm climates.
Product Warranty: Most reputable manufacturers offer 12 to 25 years on the physical product. Anything under 12 years on a tier-1 panel is a yellow flag.
Power Degradation Guarantee: This tells you how much output the manufacturer guarantees over time. A good spec is no more than 0.5% annual degradation, with a 25-year guarantee of at least 86% original output. Some premium lines (SunPower, REC) guarantee 92% at 25 years.
The degradation guarantee is one I’d ask every installer to specifically address. I’ve reviewed quotes where the installer was pushing a panel with a better headline efficiency but a weaker degradation curve. Over 25 years, the “worse” panel won on total lifetime production.
The Relationship Between Efficiency and Price
You should expect to pay somewhere around $0.40 to $0.65 per watt more for premium high-efficiency panels compared to solid mid-tier options. On a 10 kW system, that’s $4,000 to $6,500 extra before installation labor.
Whether that’s worth it depends on a few things: your roof size, your local electricity rates, how long you plan to stay in the house, and whether your utility has favorable net metering. If you’re paying $0.28/kWh in California and you have a small roof, premium efficiency probably pencils out over 20 years. If you’re paying $0.11/kWh in Louisiana with a massive unshaded roof, it almost certainly doesn’t.
There’s no universal right answer here, and anyone who tells you otherwise is either oversimplifying or selling you something. Run the numbers with your specific roof, your specific utility rate, and your specific quote.
The efficiency number on a spec sheet is a starting point, not a purchase decision. The homeowners who get the most out of their solar investment are the ones who cross-reference that number with temperature coefficient, system sizing, degradation guarantees, and their own roof constraints before signing anything. That takes maybe an extra hour of research. On a $20,000 purchase, that’s a pretty good use of an hour.
Sources
- U.S. Department of Energy’s homeowner solar guide
- Lutron Caséta Wireless Smart Dimmer Kit
- Solar Panel Cleaning Brush Kit with Extension Handle
- EG4 Battery Monitor Shunt for Solar Systems
- Renogy 200W Solar Starter Kit + 30A Charge Controller
As an Amazon Associate, we earn a small commission from qualifying purchases at no extra cost to you. We only recommend products that genuinely support the topics covered in this article.
- Renogy 200W Solar Starter Kit + 30A Charge Controller (~$169). Complete beginner solar kit with 200W monocrystalline panel, charge controller, and mounting hardware.
- Renogy 2×100W Monocrystalline Solar Panels (~$99). Expandable 200W panel set from the most trusted DIY solar brand, used widely in off-grid and home backup systems.
Photo: Hoan Ngọc via Pexels
Recommended Resources
Disclosure: As an Amazon Associate, we earn a small commission from qualifying purchases at no extra cost to you. We only recommend products that genuinely support the topics covered in this article.
- Renogy 200W Solar Starter Kit + 30A Charge Controller (~$169), Complete beginner solar kit, 200W monocrystalline panel, charge controller, and mounting hardware included.
- Renogy 2×100W Monocrystalline Solar Panels (~$99), Expandable 200W panel set from the most trusted DIY solar brand, used widely in off-grid and home backup systems.