 Tom Bradley
Roughly 20% of residential solar systems are underperforming at any given moment, and most homeowners have no idea. That’s not a scare statistic I made up. The National Renewable Energy Laboratory (NREL) has documented that soiling, shading, and inverter faults alone account for energy losses between 10% and 25% in real-world residential installations. You paid $15,000 to $30,000 for this system. A 20% loss is $3,000 to $6,000 in value you’re not getting. That’s worth spending an afternoon investigating.
I’ll be honest: the first time I got a call from a homeowner convinced their panels were “broken,” I drove out there expecting a dead inverter or a wiring fault. What I found was a bird colony that had set up shop under the array, and two panels so covered in droppings they were producing essentially nothing. The fix took forty minutes and a garden hose. The lesson I took from that job is that the most common causes of zero or low production are almost never what people assume.
Let’s work through this systematically.
Start with the obvious: is the sun actually out?
This sounds condescending, and I promise I don’t mean it that way. But before you spiral into panic about your $25,000 system failing, check the basics. Solar panels don’t produce meaningful power on heavily overcast days. A dense cloud cover can reduce output by 70% to 90% compared to full sun, according to data published by the U.S. Department of Energy. Thin clouds cut output by around 10% to 25%. So if you’re checking your monitoring app at 8 a.m. in January during a cloudy stretch and seeing 400 watts from a 10 kW system, that might actually be normal.
What surprised me was how many homeowners don’t have a baseline. They installed the system, assumed it was working, and only noticed something was wrong when their electric bill came in higher than expected six months later. If you haven’t already, install a home energy monitor (the Emporia Vue 2 is around $70 and clips onto your main panel breakers) so you’re tracking actual production daily, not guessing. Disclosure: the site may earn a commission on purchases through that link.
Also check your monitoring software. Enphase, SolarEdge, and SMA all offer apps that show per-panel or per-string production. If you’re not using them, you’re flying blind.
The inverter is the most common actual failure point
Helpful resource: Lutron Caséta Wireless Smart Dimmer Kit is a top-rated option for this. (As an Amazon Associate this site earns from qualifying purchases.)
Your panels themselves almost never fail outright. The cells are solid-state, no moving parts, and quality panels carry 25-year production warranties. What does fail, more often than the industry likes to advertise, is the inverter.
String inverters (one central box, usually in your garage or utility room) have a rated lifespan of 10 to 15 years. Microinverters mounted under each panel tend to last longer, but they can still fault out individually. A failed string inverter takes your entire system offline. A failed microinverter only kills one panel, which is why that architecture is actually better for diagnosing problems.
Here’s what to check: go look at your inverter. If it has a green light, it’s communicating and probably working. A red light, flashing amber, or no light at all is a fault condition. Write down the error code if there is one. SolarEdge inverters display codes like “Grid Fault” or “Arc Fault” on a small LCD screen. Enphase issues are tracked panel-by-panel in the Enlighten app. The inverter manual (or the manufacturer’s website) will tell you what the code means. I’ve personally seen “AC Disconnect Open” cause a complete system shutdown because a homeowner accidentally bumped the manual disconnect switch in their garage. Two-second fix, looked catastrophic on the monitoring app.
If the inverter is unresponsive, try this before calling anyone:
- Turn off the AC disconnect (the breaker on your main panel labeled “Solar” or “PV System”).
- Wait 5 minutes.
- Turn it back on.
- Give the inverter 10 minutes to reconnect to the grid.
That reboot sequence clears a lot of fault conditions, especially after a grid disturbance. Utilities sometimes push voltage fluctuations that trip inverters into a protective shutdown mode. NREL data suggests inverter-related issues are responsible for a significant portion of residential production losses, with some estimates putting inverter downtime at 10-15% of total system downtime events.
Shading: the silent killer nobody tracks
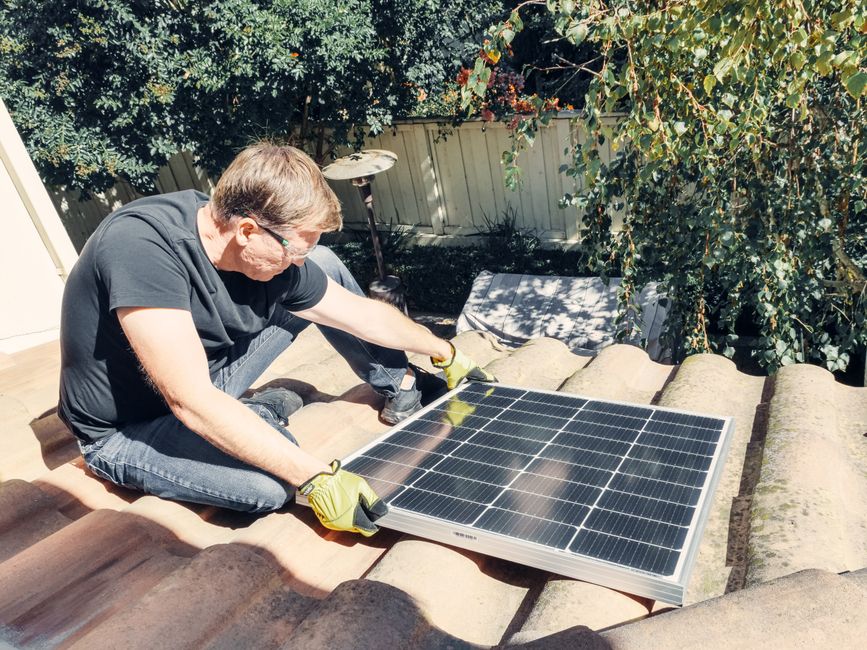
Do It Yourself Solar Power? - Easy DIY Solar Panel Installation! · JerryRigEverything on YouTube
Here’s where I get opinionated. The single biggest ongoing production killer I see in residential systems is shading that wasn’t properly accounted for at installation, or that developed after installation as trees grew. A shadow covering just one cell in a standard 60-cell panel can reduce that entire panel’s output by 30% to 50% depending on whether bypass diodes are wired in (good installers wire them in; not all do).
If you have a string inverter without panel-level power optimizers, a single shaded panel drags down every panel in that string. String behavior is the weak-link problem: the lowest-performing panel sets the ceiling for the whole group. This is why SolarEdge optimizers or Enphase microinverters add real value in shaded environments, not just as marketing.
Go outside at solar noon (roughly 1 p.m. local time in summer) and look at your array from the ground. Any shadows at all? Now do the same at 10 a.m. and 3 p.m. A tree branch that seems harmless might be throwing a shadow across two panels during peak production hours. I’ve seen installations where a neighbor’s new fence addition cut system production by 18% because it shaded the bottom row of panels for two hours every afternoon. The homeowner didn’t notice for three months.
Soiling, debris, and what to actually do about it
Rain cleans panels reasonably well in most climates, but not perfectly. In areas with heavy pollen (Atlanta in April is genuinely brutal), near agricultural fields with dust, or under trees with sticky residue from aphids, production losses from soiling can hit 5% to 15% annually according to research cited by the Solar Energy Industries Association (SEIA). In desert climates without rainfall, unclean panels can lose 25% or more.
What surprised me when I looked into this more carefully is that panel cleaning frequency matters less than most people assume. The research here is genuinely mixed. Some studies show diminishing returns from cleaning more than twice a year. Others, in high-soiling environments, show monthly cleaning is justified. Your specific microclimate matters more than any general rule.
If you’re in a region with mild rainfall and no heavy pollen or dust, annual cleaning is probably fine. A simple rinse with a garden hose (no pressure washer, no abrasive scrubbing, don’t use soap unless it’s specifically formulated for panels) handles most deposits. For anything more serious, a solar panel cleaning kit with a soft brush and extension pole runs $40 to $80 and gets the job done from the ground on a single-story installation. Don’t go on the roof if you don’t have to. Site may earn a commission.
One thing only someone who’s done this knows: clean in the early morning or evening, never midday. Cold water on a hot panel creates thermal stress. I’ve seen microcracks develop from exactly this, and while it’s not guaranteed damage, it’s not worth the risk.
Why the numbers don’t add up: a common causes comparison
| Cause | Typical Production Loss | DIY Fix Possible? | Cost to Fix (if not DIY) |
|---|---|---|---|
| Full cloud cover | 70-90% (temporary) | N/A | N/A |
| Panel soiling / dirt | 5-25% | Yes | $150-$300 (cleaning service) |
| Shading (trees, structures) | 10-40% per affected string | Partial (trimming) | $300-$2,000+ (tree work) |
| Inverter fault / shutdown | Up to 100% | Sometimes (reboot) | $1,200-$3,500 (replacement) |
| Failed microinverter | ~3-8% per unit | No | $200-$400 per unit installed |
| Tripped breaker / disconnect | Up to 100% | Yes | $0 |
| Damaged panel (physical) | Variable | No | $250-$600 per panel replaced |
| Wiring/connection fault | Variable | No | $200-$800 (electrician) |
| Net meter communication issue | Billing only, not production | Sometimes | Call utility |
Current as of July 2026, based on installer pricing in mid-Atlantic and Southwest U.S. markets. Prices vary significantly by region and labor costs.
Production by month: setting realistic expectations
That July peak versus January baseline is a nearly 2x swing, and it catches a lot of new solar owners off guard. A system producing 400 kWh in February isn’t broken. It might be performing exactly as modeled. Pull up your original installation proposal. It should include a monthly production estimate. If actual production is within 10% of that estimate, your system is likely fine. If you’re 25% or more below the modeled number for multiple consecutive months, that’s worth investigating.
Three real scenarios I’ve personally walked through:
A homeowner in suburban Philadelphia with a 9.6 kW system noticed production dropped from roughly 1,100 kWh/month in August to 610 kWh in October. She called panicking. We checked the monitoring data: two microinverters had faulted out in September and hadn’t been noticed. Combined loss across two months: approximately 180 kWh, which at $0.16/kWh was about $29 in unproduced value. Not catastrophic, but real. Enphase warranty covered the replacement units.
A reader emailed me last spring after his SolarEdge system flatlined completely. Error code on the display: “Grid Fault.” His utility had done maintenance the previous day and the reconnection pushed voltage out of spec. System wouldn’t re-energize automatically. Simple fix: cycle the AC disconnect, wait ten minutes, call the utility to verify grid voltage. Back online within an hour.
A new build in Arizona installed panels on a south-facing roof, looked perfect on paper. Six months later the owner noticed underperformance specifically in late afternoon. An HVAC company had added a rooftop unit that now threw a shadow across the bottom two rows of panels between 3 and 5 p.m. Production loss calculated from monitoring data: roughly 14% of daily output. Fix: two SolarEdge optimizers retrofitted to the affected panels for about $380 installed, recovering most of the loss.
When to actually call someone
I’m not going to tell you to always call a pro immediately, because frankly, a lot of the most common issues are DIY-diagnosable in under an hour. But some situations genuinely require a licensed electrician or certified solar technician:
Any fault that involves DC-side wiring. DC current from a solar array doesn’t trip breakers the same way AC does and can maintain an arc that causes fires. Don’t touch the wiring between panels and the inverter yourself unless you’re licensed.
Physical panel damage (cracked glass, delamination, visible burn marks). A thermal camera inspection, which many installers offer for $150 to $300, can identify hotspots invisible to the naked eye.
Inverter replacement. Disconnect procedures, grid interconnection rules, and sometimes permit requirements apply. In most jurisdictions you need a licensed electrician to swap an inverter legally.
If your installer is still under their workmanship warranty (typically 5 to 10 years), call them first. Document everything: screenshots from your monitoring app, photos, dates, production numbers. If they’re unresponsive, your state’s contractor licensing board is the next call, not the BBB.
Sources
- National Renewable Energy Laboratory (NREL) PVWatts Calculator: Production modeling tool used by installers and researchers; underlying meteorological data cited for monthly production estimates.
- U.S. Department of Energy, Homeowner’s Guide to Going Solar: Official federal resource on residential solar performance and system components.
- Solar Energy Industries Association (SEIA): Industry data on soiling losses, installation trends, and residential system performance benchmarks.
- NREL Technical Report, “Photovoltaic System Performance”: Peer-reviewed documentation of real-world residential losses from shading, soiling, and inverter faults; basis for the 10-25% underperformance range cited.
- NREL “Inverter Performance and Reliability” research: Underlying basis for inverter lifespan estimates and failure-mode frequency data.
Recommended Resources
Disclosure: As an Amazon Associate, we earn a small commission from qualifying purchases at no extra cost to you. We only recommend products that genuinely support the topics covered in this article.
- Renogy 200W Solar Starter Kit + 30A Charge Controller (~$169), Complete beginner solar kit, 200W monocrystalline panel, charge controller, and mounting hardware included.
- Renogy 2×100W Monocrystalline Solar Panels (~$99), Expandable 200W panel set from the most trusted DIY solar brand, used widely in off-grid and home backup systems.