 Morgan Johnson
You checked your monitoring app this morning and your system produced 4.2 kWh yesterday when it normally does 28. Now you’re second-guessing every decision you made signing those installation contracts. I’ve been there, and I’ve gotten this panicked message from readers more times than I can count. The good news: low production is almost never the disaster it feels like in the moment. The bad news: finding the root cause requires actually looking at a few different things, not just refreshing the app and hoping the number changes.
Let me walk you through how I actually think about this problem.
Start With the Obvious: What Did the Sky Look Like?
| Issue | Production Impact | Detection Method |
|---|---|---|
| Full overcast sky | 70-90% reduction | Check weather app; production graph appears flat |
| Partial cloud cover | Variable; inconsistent spikes/drops | Production graph appears jagged |
| Haze/smoke/humidity | 20-40% reduction | Visual observation; mostly clear appearance |
| Soiling (dust/pollen) | 1.5-6.2% per month; up to 18% during pollen season | Visual inspection of panel surface |
| Bird droppings | Disproportionately high; can affect entire string | Visual inspection; hard shadow on panels |
| Seasonal shade shift | Varies by obstruction | Compare panel shadows across seasons; check roof vents, chimneys, neighboring structures |
This sounds condescending, but stick with me, because I’ve seen homeowners call their installers in a panic over a cloudy Tuesday. Weather is the single biggest driver of day-to-day production swings, and most monitoring apps don’t give you great context for it.
A fully overcast sky can cut your production by 70 to 90 percent compared to a clear day. Partial cloud cover is trickier because it’s inconsistent and can produce weird spikes and drops throughout the day that look alarming on a graph. A hazy summer day, think wildfire smoke or heavy humidity, can chop 20 to 40 percent off your output without a single cloud in sight.
Here’s what I actually do: I pull up Weather Underground’s historical data for my zip code and look at solar irradiance or cloud cover hour by hour for the day in question. You can also cross-reference against your monitoring app’s production curve. On a good clear day, your production graph should look like a smooth bell curve peaking around solar noon. If it looks jagged or flat, weather is almost certainly involved.
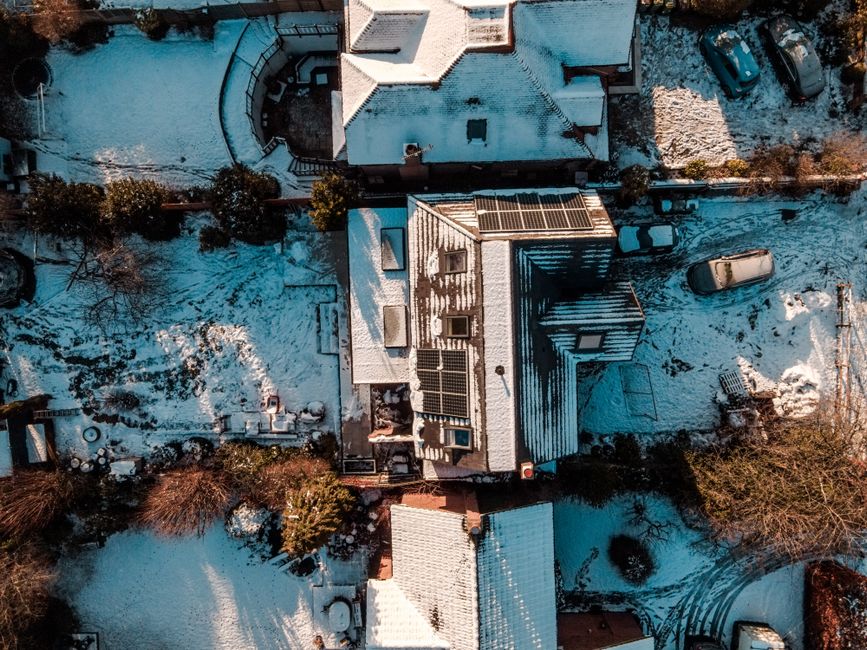
One specific thing most people don’t realize: a light dusting of snow that’s mostly melted by 10 a.m. can still kill your morning production, which gets stripped from the daily total. Spring days where clouds move in and out can produce numbers that look broken but are completely normal.
Before you call anyone, check the weather.
The Dirty Panel Problem (More Common Than You’d Think)
If the weather checks out and your production is still soft, look at your panels. Not through your app. Actually go outside and look at them.
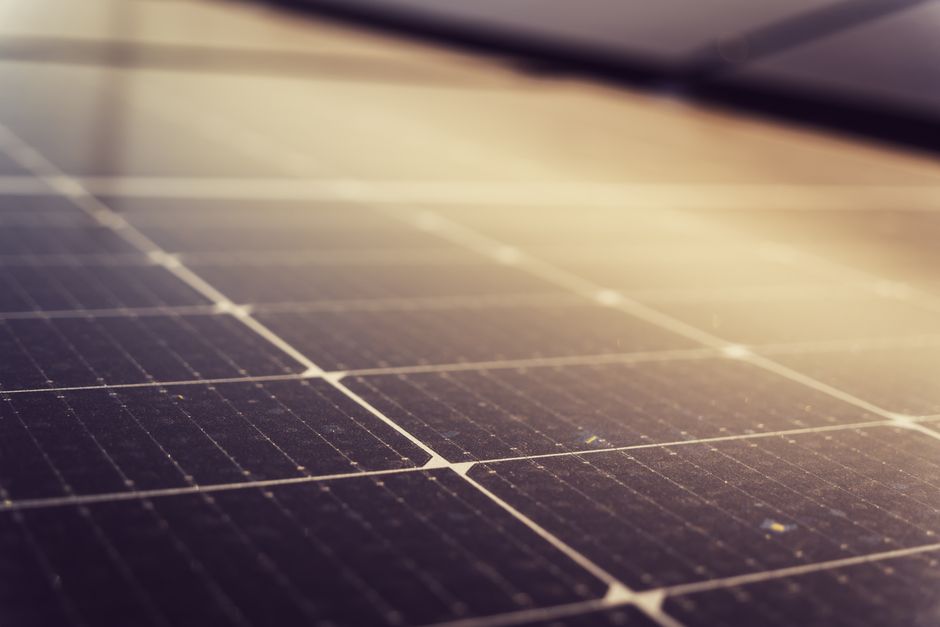
Soiling losses are real and chronically underestimated. The National Renewable Energy Laboratory has published research showing soiling can account for anywhere from 1.5 to 6.2 percent loss per month in certain climates, and in dusty regions like Southern California, Arizona, or West Texas, that number climbs fast. Pollen season in the Southeast is brutal. I’ve personally seen a system in suburban Atlanta drop nearly 18 percent below expected output in late April just from pine pollen coating the glass.
Bird droppings are a separate category entirely. Unlike dust, which diffuses light somewhat uniformly, a dropping creates a hard shadow over one spot on a cell. Depending on how your panels are wired, that single dropping can affect the output of an entire string, not just one panel. It’s disproportionately damaging.
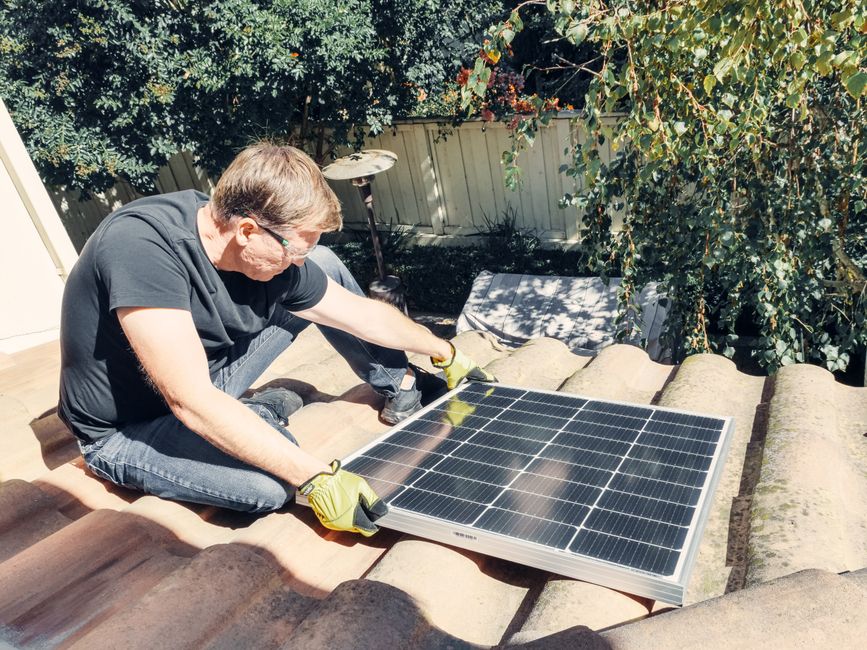
If you’re comfortable on a roof (and have the right footwear and safety setup), a simple rinse with a garden hose during early morning hours works for dust. For stuck-on debris and droppings, a soft-bristle solar panel cleaning kit with a long-handled brush and squeegee makes the job much easier without scratching the glass. Skip the pressure washer. Every installer I know has a war story about a homeowner who pressure-washed their panels and voided their warranty in one afternoon.
Helpful resource: Emporia Smart Outlet with Energy Monitoring is a top-rated option for monitoring. (As an Amazon Associate this site earns from qualifying purchases.)
Shade: The Sneaky Seasonal Shift
How Many Solar Panels Do You Need? Follow This Easy Breakdown! · Top Homeowner on YouTube
Here’s something installers often fail to explain at the sale: your shade situation changes throughout the year. A tree that wasn’t a problem in December can absolutely hammer your production in June because the sun is at a higher angle and the shadow falls differently.
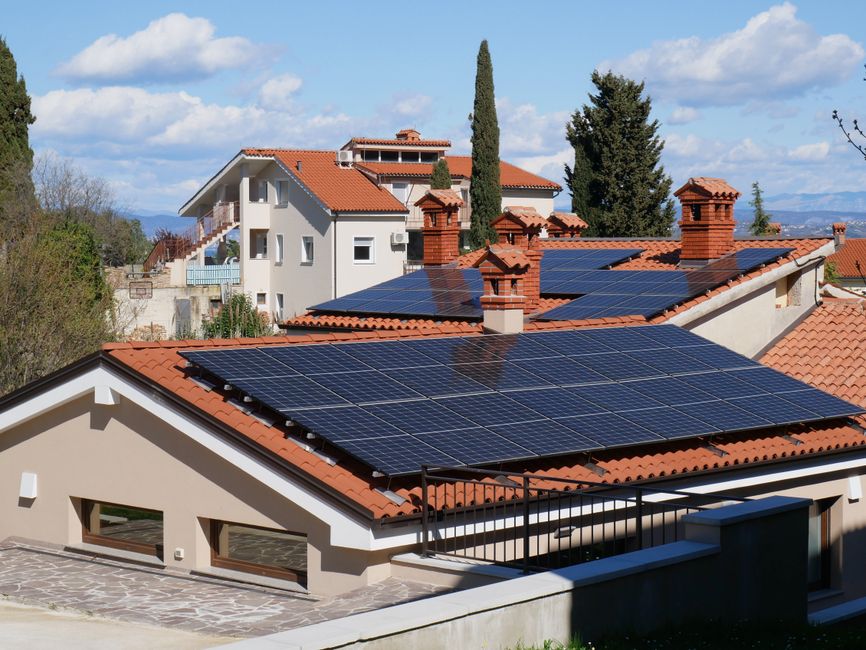
I’ve seen this specifically with roof vents, chimneys, and neighboring homes. A chimney that sits behind your panels in winter can throw a long shadow directly across them at 9 a.m. in June because of how the sun arc shifts. If you installed in the fall or winter and are now hitting your first full summer, this is worth investigating carefully.
The fix here isn’t always obvious. If it’s a tree you own, trimming is straightforward. If it’s a neighbor’s tree or a structural element of your house, you may need to look at whether microinverters like the Enphase IQ8 series or power optimizers (SolarEdge is the dominant player) were installed. These technologies mitigate shade impact at the individual panel level. If your system uses a traditional string inverter without optimizers and you’ve got partial shading, you’re leaving significant production on the table and you were probably undersold.
Inverter and Equipment Issues
So the weather was fine, your panels look clean, there’s no new shade. Now we get into equipment.
Your inverter is the most common hardware failure point. Most modern inverters have some form of error reporting, either through a display on the unit itself or through a connected monitoring portal. SolarEdge, Enphase, Fronius, and SMA all have app-based monitoring that shows you fault codes. Before you call your installer, check those.
A few specific things to look for:
Enphase systems report per-microinverter, so if you’ve got 18 panels and 3 microinverters are showing offline or producing near zero, that’s a targetable problem. Your installer can often see this too from their end without coming to your house.
SolarEdge string inverter systems show string-level production, and if an entire string is down, you’ll see a dramatic drop in daily output. Sometimes this is a tripped DC disconnect. Sometimes it’s a failed optimizer on one panel dragging the string down. Sometimes the inverter itself has a fault.
A reader emailed me last month about a Fronius Primo that was throwing a “Grid Fault” error and producing nothing for three days while she waited for her installer to respond. That error, in her case, meant her utility had briefly changed the grid frequency during local infrastructure work, the inverter detected it as an anomaly, and it never fully reset. The fix was a manual restart. Three minutes. If she’d known to check the Fronius error codes herself, she wouldn’t have lost three days of production in July.
This is why I strongly recommend a home energy monitor like the Emporia Vue or Sense alongside your inverter’s native monitoring. A second data source helps you triangulate whether the problem is the solar system, the inverter reporting, or something downstream in your home’s electrical panel.
The Production Math Nobody Does Upfront
A lot of “my production is low” anxiety comes from comparing today’s output against an expectation that was never grounded in real numbers. EnergySage’s market data consistently shows that homeowners tend to overestimate their expected daily production, partly because installers quote peak-hour numbers under ideal conditions and partly because no one explains seasonal variation clearly enough.
Your system in December in Michigan is not going to produce what it does in July. Full stop. A 10 kW system in Minneapolis might do 55 to 60 kWh on a clear June day and only 10 to 12 kWh on a clear December day because of sun hours alone. If your installer or the SEIA’s own data resources don’t make this clear during the sales process, that’s a problem.
I’d recommend pulling up PVWatts, NREL’s free calculator at pvwatts.nrel.gov, and running your own simulation for your system size, tilt, and location. It gives you month-by-month production estimates. Compare that to what you’re actually producing. If you’re consistently running 15 to 20 percent below PVWatts estimates after accounting for weather, that’s when you’ve got a real problem worth escalating.
Sources
- Emporia Smart Outlet with Energy Monitoring
- Jackery Explorer 300 Portable Power Station
- Emporia Vue 2 Home Energy Monitor
- Renogy 200W Solar Starter Kit + 30A Charge Controller
- Renogy 2×100W Monocrystalline Solar Panels
Disclosure: As an Amazon Associate, we earn a small commission from qualifying purchases at no extra cost to you. We only recommend products that genuinely support the topics covered in this article.
- Renogy 200W Solar Starter Kit + 30A Charge Controller (~$169), Complete beginner solar kit, 200W monocrystalline panel, charge controller, and mounting hardware included.
- Renogy 2×100W Monocrystalline Solar Panels (~$99), Expandable 200W panel set from the most trusted DIY solar brand, used widely in off-grid and home backup systems.
Photo: Kindel Media via Pexels
Recommended Resources
Disclosure: As an Amazon Associate, we earn a small commission from qualifying purchases at no extra cost to you. We only recommend products that genuinely support the topics covered in this article.
- Renogy 200W Solar Starter Kit + 30A Charge Controller (~$169), Complete beginner solar kit, 200W monocrystalline panel, charge controller, and mounting hardware included.
- Renogy 2×100W Monocrystalline Solar Panels (~$99), Expandable 200W panel set from the most trusted DIY solar brand, used widely in off-grid and home backup systems.